


Not financial advice, full disclaimer available here.
Every integrated oil and gas company (IOC) is different. Petrobras is big in oil. European majors are big in trading. Exxon has massive refining capacity… So it’s best to look at several metrics when comparing companies together.
Let’s consider another way of looking at the price of reserves than the one discussed last week. The metric is reserves life by price. It’s calculated by dividing the reserves to production ratio by the price to earnings ratio (P/E). That way, all profits count and assumptions are more straightforward. Results are illustrated below.1

The higher the ratio, the cheaper the stock. Petrobras has 12.2 years of proved oil & gas reserves and trades at a P/E of 1.8. Therefore, the reserves life by price ratio is 6.6. Notice that every stock is now trading at a discount (i.e. above 1). The ranking has also changed, with Shell and Exxon beating Chevron and Total, but the lower-valuation companies remain the same.
By the way, 12 years is the same maturity as the outstanding debt for Petrobras. If the average creditor is willing to look out 12 years, why can’t equity investors look out 6 or 8 years? PBR’s valuation is all sentiment. Even if the stock multiple does not expand, the unmatched dividend yield endures.
More than a cheap stock, the Brazilian oil major is a high-return business in an energy bull market.
Return on capital employed (ROCE) measures how efficiently a company is using its capital to generate profits. I was surprised to read that Petrobras’ ROCE is 15.9% (source), the lowest of the peer group. I get a higher return on assets than 15.9% which makes no sense. There has to be something different in the way it’s calculated. Comment below if you know where to find the detailed calculation.
Here are the 2022 company numbers for RO(A)CE versus those I have calculated (see footnotes).2

Petrobras is looking a lot better while BP is penalized under traditional accounting rules. The average is about the same and you can check these against other return ratios like return on equity (ROE) and return on invested capital (ROIC) on financial websites, or calculate your own.
This next chart plots two variables: one for quality (ROCE) and one for price (EV/EBIT: enterprise value divided by earnings before interest and tax).
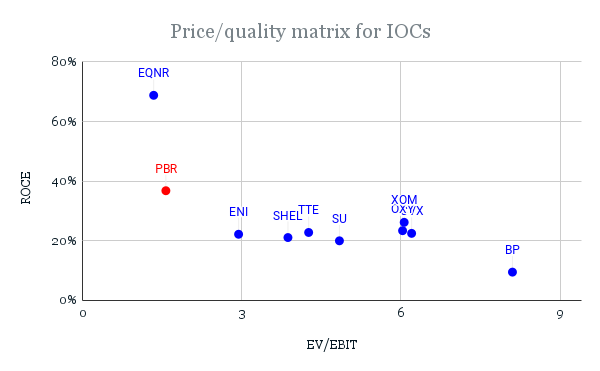
A high ROCE and a low EV/EBIT multiple is best. Norway’s Equinor wins this one by a long shot. It’s worth investigating the company further. Petrobras ranks second. US companies have a very similar score. BP seems to be an outlier, but it gets closer to its European peers after management adjustments.
Again, market expectations for Petrobras are extremely low. The stock multiple is 3 times lower than Suncor’s. Is the risk/reward 3 times worse? Political risk is not 3 times higher in Brazil than the west, at least that’s what I am betting on.
BP recorded an earnings loss in 2022. I used free cash flows to calculate BP’s reserves life by price so the ratio isn’t meaningless.
Some companies report return on capital employed (ROCE) and others report return on average capital employed (ROACE). The formula I used is: ROCE = earnings before interest and tax / (assets - current liabilities).
Thank You. Interesting article, makes me want to investigate EQNR more. Whats interesting to me regardless PBR this weekend is the price action on BAK last week vs PBR’s 36% ownership.